 For most retailers, simply collecting data on your sites, apps and customers isn’t the challenge. On the contrary, it’s more likely that you’re awash in data and struggling to consistently derive value from it.
The challenge of actually activating your data for a competitive advantage is often thought of as a technical problem: If only we had these tools or these features, the thinking goes, then we’d be able to use data as a true asset.
Not so fast. The struggle to derive value from data isn’t primarily a technical challenge. Instead, it’s a strategic challenge.
Of course, it’s important to have the right tools available for your team. But even with all best-in-breed tools money can buy, a strategic, objectives-driven approach to analytics — what I call a “measurement framework” — is a prerequisite to creating value using your organization’s data.
Indeed, all the work we do in analytics, whether on the technical side or the number-crunching side, should be driven by a robust, documented framework for analytics. Putting that foundational framework in place is the key to consistently, repeatably activating your data for a competitive advantage.
Many organizations track a lot of metrics well — but do so in a vacuum. It’s easy to know when your bounce rate has gone down, or your conversion rate has improved — because all you need is a tool and a few minutes to glance at the numbers.
To make those observations valuable, we have to be able to do something about them. That’s where the measurement framework comes in.
To be actionable, your insights have to be relevant and specific. To be relevant, any metric you report on needs to “ladder up” to your fundamental business objectives. To be specific, you need a rigorous approach to segmentation — so that you’re not reporting metrics in aggregate, for users who have nothing in common with each other.
A measurement framework helps you accomplish these things: It ensures that your metrics are always collected and reported in the context of business objectives, and adds the segmentation layer that you need to capture those highly specific, actionable insights.
Let’s take a look at the different pieces of a measurement framework, so you can get started on putting one together for your organization.
Step 1: Define your business objectives
Defining your business objectives might sound like a gimme, but in my experience, it’s often much more complicated than you might first assume.
For example, when you ask sales, marketing, operations, supply chain and finance what their key objectives are, there’s a good chance you’re not going to hear the same thing from all groups. That’s OK — each group should be able to measure the performance metrics that matter most to them.
But when it comes to building a measurement framework that underpins your marketing optimization efforts, you’re likely going to have to “boil down” the objectives you hear from your various stakeholders until you’re left with the things that all groups have in common.
A common mistake when defining business objectives is to prematurely focus on how you’ll measure progress against any given objective. You may not know how to measure whether your investment in free shipping is generating stronger brand affinity or greater advocacy on social, but that’s OK. If generating that brand affinity or social advocacy is a key objective, get it out on the table.
Don’t assume that anything is impossible to measure, or you’ll lose sight of what your organization’s real goals are.
Step 2: Categorize your objectives using a framework
Once you’ve got a stack of business objectives that you want to measure, it’s time to put some structure around them. A measurement framework helps you bring order to chaos so that you aren’t drowning in KPIs that don’t have anything to do with each other.
For example, you may be able to group your objectives in terms of where the they fit into a Net Income framework. This helps you ensure that all the KPIs you ultimately decide to measure clearly contribute to what is likely your uber-goal: profitability.
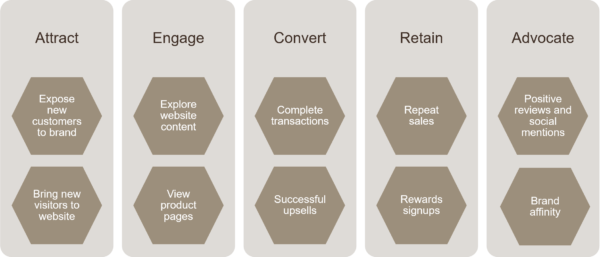
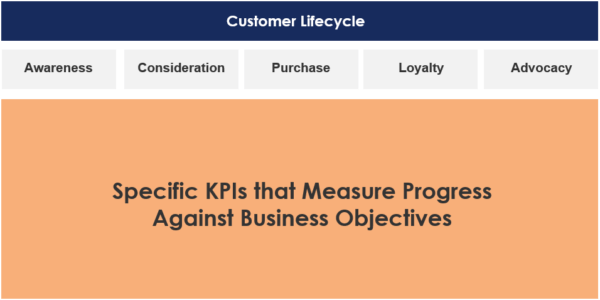
Alternatively, you can group your objectives by thinking about where they fit into your customer’s overall journey. This is another common approach that helps to “humanize” your data, and also helps you to understand which levers you can pull to improve overall performance.
For example, if conversion rates are improving, but at the expense of a smaller overall audience, a measurement framework that’s grounded in the customer journey can help you see that very clearly.

There’s no one correct framework for web analytics data, so don’t worry so much about whether you’re choosing the “right” one. The goal of a framework is to provide structure to your data, highlight your key optimization opportunities and help stakeholders consistently generate value using the data you collect.
Try a couple of different frameworks for grouping your business objectives, and get feedback from the organization. Perhaps the Net Income framework is crystal-clear, and you get consensus that this is the best framework for your team.
Alternatively, perhaps a Customer Journey framework helps your team understand performance. Go with what works for your organization’s particular circumstances.
Lastly, don’t forget to revisit your framework over time. As your business evolves and your goals change, it’s easy to wind up with a measurement framework that no longer speaks to the objectives you’re working toward. So, once a year (or so), take a step back and give your measurement framework a once-over, to ensure it’s still complete and as relevant as possible.
Step 3: Develop specific KPIs
Once you’ve chosen a framework for grouping your business objectives, it’s time to figure out exactly how you’ll measure progress (or lack thereof) against those objectives. In other words, it’s time to identify your specific KPIs.
Now, maybe I’m just a very literal-minded person, but I tend to think that KPIs should be indicative of performance. That means vanity metrics (sessions, unique visitors, time on site) probably aren’t good candidates — even if they’re easier to measure than other metrics.
I also believe that less is more; after all, if all metrics are important, then no metrics are important. Fight the temptation to list every possible metric as a KPI, and instead home in on only those metrics that best represent progress against the objective.
Again, don’t worry too much about how you’ll get this data. If the metric that would be the best KPI is a bit more difficult to get at, that’s OK. In fact, having the technical implementation of your analytics tools be driven by your business objectives is a direct outcome, and benefit, of a robust measurement framework.

Lastly, it’s important to build consensus around these specific KPIs. Different stakeholders may have varying points of view on which metrics really are KPIs and which are vanity metrics.
Ideally, by facilitating that conversation, and coming to a broad agreement across the team, the KPIs you do select become the “coin of the realm” when it comes to insights and optimization. In other words, your team speaks a common language when it comes to insights, and you don’t get bogged down in arguing about metrics definitions, translating between two teams’ chosen metrics and so on.
Step 4: Focus on segmentation
Finally, we’ve reached the last step. By now, you’ve documented your business objectives, used a framework to organize and group them and identified specific KPIs to measure progress against them. Now, it’s time to build an approach to segmentation that helps us get the specific, granular insights that are much more likely to be actionable — and therefore valuable.
Even if you’ve built broad consensus about which KPIs to track, reporting them in aggregate too often leaves the team wondering exactly where the optimization opportunities are. Adding on a rigorous segmentation approach, by contrast, ensures that those specific opportunities are surfaced much more easily.
When it comes to web analytics, your segmentation options are infinite — you can take your KPIs and break them down by geography, landing page, day part, mobile device and so much more. And that’s all great, but to really make your segmentation consistently, repeatably actionable, you should consider building customer-based segments.
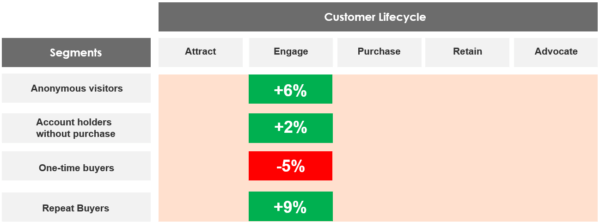
For example, break down your site’s audience based on a person’s previous purchase history. A robust segmentation will be both mutually exclusive and collectively exhaustive — or “MECE” — as shown below.

Here, we can see that all of the people who visit our site will fall into one, and only one, of these segments. In addition, nobody who has visited the site will fail to be in one of the segments.
In other words, segmenting our KPIs this way ensures that we have complete coverage of our user base, without any redundancy or overlap.
Layering your segmentation scheme onto a measurement framework is the critical last piece to making sure your insights are actionable. You’ll be able not only to see that a given KPI is improving or worsening, but you’ll also be able to tie that to a specific set group of people.
From there, your next steps should be much clearer. For example, perhaps you need to invest in more retargeting to improve your customer retention performance with buyers outside the US. Or maybe you should redesign your product detail pages for mobile users who have never purchased before.
Of course, the possibilities are infinite, but a robust measurement framework provides you with the “north star” you need to ensure that your web analytics efforts are specific and actionable, and that they directly align with your key business objectives.
Some opinions expressed in this article may be those of a guest author and not necessarily Marketing Land. Staff authors are listed here.

