Google is making a small change to how it reports AdWords Quality Score (QS) on October 10. While ad rank and the auction aren’t changing, advertisers using a tool or script to track QS may need to update their automations. I’ve updated Optmyzr’s (my company) free AdWords Script that calculates account-level QS to be compatible with the change in reporting, so grab a copy of that code at the end of my post.
The announced change is not a big deal, but some of the other recent AdWords changes, like Expanded Text Ads (ETAs) and device-level bid modifiers, also have an impact on QS that I haven’t seen many discussions about. So I’ll share my thoughts on what these other changes mean for QS.
October 2016 Quality Score reporting change
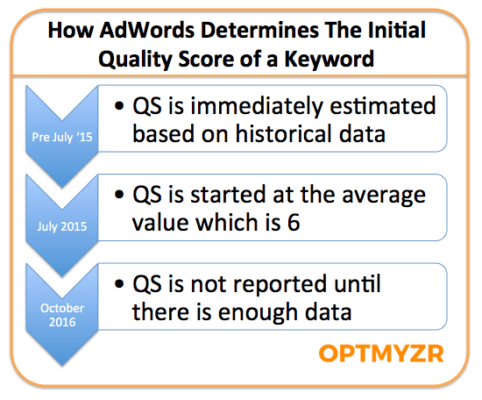
Google originally planned for launch of reporting of null Quality Scores on September 12, but then delayed the launch to October 10. As part of this change, Google will report a QS of null (shown as “–” in reports and the interface) when there is insufficient data for a keyword. This means that newly added keywords and low-volume keywords will no longer show a Quality Score of 6.
Starting off keywords with too little data at the average QS of 6 began during the July 2015 update. Before that, the starting QS was calculated by combining historical data from other advertisers who had used the same keyword with data about the advertiser’s historical performance. Google had assumed the new keyword would perform average compared to everyone else using the same keyword, with a positive or negative adjustment based on whether the advertiser usually had better or worse than average QS in their account.
More transparency in AdWords
While I miss the days when I could see an immediate estimate of the Quality Score for new keywords, I am still excited that new keywords will now show no QS rather than a 6. It adds back a level of transparency I’ve missed for the past year.
Rather than mixing together keywords that have earned a QS of 6 with those that don’t have enough data, now the score you see is the score you get. That means it’s easier to take action on keywords that actually need an optimization, and advertisers won’t waste time optimizing keywords that are simply waiting for more data.
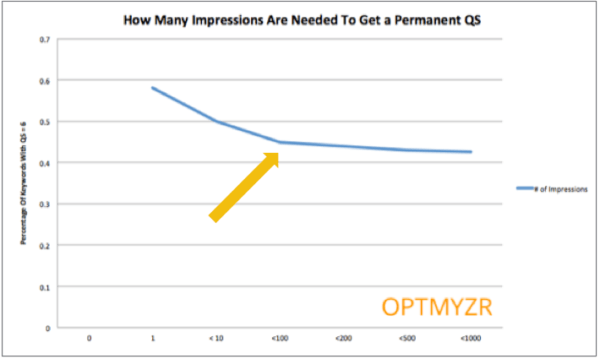
To help advertisers who needed to know whether a keyword with a Quality Score of 6 was just waiting for more data, Optmyzr did a research project after the July 2015 change where we determined that after about 100 impressions, chances were high that Google knew the real QS for a keyword.
Now, we no longer need to rely on these types of approximations to determine when a keyword has a real Quality Score. When the number 1–10 appears next to a keyword, we’ll now know this is its real QS, and we can confidently act on that.

Keywords with fewer than 100 impressions have a much higher chance of changing QS than those with more than 100 impressions, leading us to believe that it usually takes Google up to 100 impressions before it has enough data to determine a keyword’s real Quality Score.
The only bad thing about this change that I can think of is that it breaks some reports and automations. So if you have automated rules or scripts that assume every keyword will have a numerical non-zero QS, you have about one week left to go and update those.
Visible Quality Score will change
It’s helpful to remember that there are many Quality Scores: the number 1–10 shown next to every keyword is called the visible Quality Score and represents a normalized average for the keyword. It’s based on performance data when the keyword matches exactly to the query on Google.com, regardless of device type.
If you’re wondering what I mean by “normalized,” Google normalizes performance data to ensure that QS is based on an apples-to-apples comparison of all competing ads. For example, they correct for differences in performance that are due to an ad’s position on the page. More on that later.
The way Google calculates visible QS is not changing in October; however, they way they report it will change for keywords without enough recent data.
Real-time Quality Score doesn’t change
Another Quality Score is the real-time Quality Score, which is used to rank and price ads every time a search happens. This score is based mostly on click-through rate (CTR) and takes into account a wide variety of signals like the time of day, day of week, location of the user, previous searches by the user, the exact phrasing of the query and so on.
When I worked at Google, we even looked into whether the lunar cycle could be a useful signal, but when we saw it didn’t correlate with CTR we scrapped that one. The real-time portion of QS is not changing on October 10.
Now let’s take a look at what some of the recent non-QS updates to AdWords have meant for QS.
You can now see your mobile Quality Score
Now that we can once again create mobile-only campaigns by setting a -100% bid adjustment for computers and tablets, you can actually see a different Quality Score number for the same keyword when it’s targeting different devices.
Up until now, the visible QS blended performance data from all devices. Now, when you replicate a keyword with its associated ads for a different device, the scores can actually differ. This allows you to see if there are opportunities to improve QS by rewriting the ads for a particular device where the QS is weaker.
Real-time QS doesn’t change and will continue to use the device type as a signal to rank ads that perform better on a particular device, higher. In fact, real-time QS most likely already uses more granular information than just the type of device to show more relevant ads. The machine learning system should be able to see if a particular ad does better on iOS smartphones than Android smartphones and adjust the ad ranks accordingly.
Quality Score after the removal of right-hand side (RHS) ads
Another big recent change is that there are no longer text ads on the right side of the search results pages (SERPs). How has this impacted Quality Score?
There are big differences in CTR for ads shown in different locations on the SERP, so this should have a significant impact on QS. However, remember that Google normalizes the performance data to remove any impact an ad’s location has on its performance.
So this means that visible QS is not impacted by the removal of RHS ads. Google has simply updated its normalization formulas to handle the new locations that are currently available to ads.
One thing you may find interesting is that Google doesn’t only normalize for an ad’s rank (i.e., whether an ad gets position 1 or 5), but also how many other ad locations are occupied at the same time. So, for example, the normalization formula is different for an ad in position 1 when there are three ads above the organic results vs. when there are four ads at the top of the page.
My personal experience has always been that bidding aggressively for new keywords usually helps me build a good Quality Score more quickly, indicating that the normalization formulas used by AdWords are not always perfect.
Thanks to normalization, real-time QS has also not changed. However, the ad rank formula, which is what we really care about when we discuss QS, was changed as a result of the new layout of the SERPs. AdWords has thresholds for when ads are eligible to be shown above organic results, and when they went from a maximum of three top ads to four top ads, there was a change in the formula.
Ultimately, any Quality Score changes related to the new layout are beyond advertisers’ control, so the main things to pay attention to are the usual KPIs, like profitability.
Get better Quality Score with expanded text ads and new extensions
Now that we have expanded text ads (ETAs) with significantly more space to write compelling ads, plus new extensions like the price extension, how do those impact Quality Score?
Well, hopefully we’re able to use all that extra text to compel more people to click our ads, and that should lead to a better CTR (though that’s not uniformly what advertisers are experiencing).
Extensions
When it comes to ad extensions, like position, their impact on performance is normalized out of the equation. That’s the only fair way to compare all advertisers when they don’t all use the same ad extensions.
But even though extensions are not a part of the visible QS, they are part of the ad rank formula. And that makes sense considering that Google is a for-profit business. When given two ads with the same Quality Score and max CPC, but one with CTR-boosting extensions and the other not, which one do you think they’ll show?
Users, advertisers and investors alike should be happy Google ranks the ad that made itself more useful by leveraging extensions more highly.
Expanded text ads
Advertisers that are improving CTRs with ETAs may have a better chance to appear at the top of the page because they are able to beat the aforementioned top-of-page promotion threshold. Google founders Larry Page and Sergey Brin were not eager to put ads on their search engine when they first commercialized it, but when they had to compromise, they agreed that ads should never make a page less useful.
This is still true today. This core tenet translates into the fact that ads must be at least as useful as organic results to qualify for the top of the page. In other words, if a query has low commercial intent, organic results will be more useful for users, and ads may be relegated to the bottom of the page or not even be allowed on the page at all.
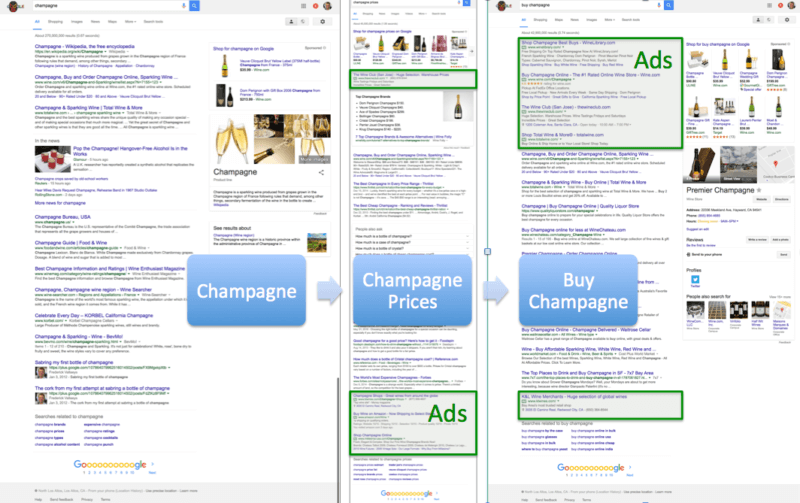
Here’s a great example to illustrate that the number of ads and their location on the page remains heavily influenced by how commercial a search is. It’s not clear how commercial a search for “champagne” is, but searches for “champagne prices” and “buy champagne” are more likely to be commercial, so they feature ads more prominently.

As queries become increasingly commercial, there are progressively more ads on the SERP, as illustrated in these three searches related to “champagne” on Google.
This also illustrates another important fact about Quality Score in AdWords: QS is an absolute measurement of relevance, not a relative measurement. What I mean is that AdWords is not just trying to show the best available ads; it only wants to show good ads. If all ads are bad, they won’t show the best bad ad first.
Bing has shifted a lot more in this direction, too, but you can see that for them the bar is sometimes still a bit lower, and they show several ads at the bottom of the page for the query “champagne.”
Impact of dynamic keyword insertion (DKI) on Quality Score
Can we improve “ad text relevance,” one of the three components of AdWords QS, by using DKI or by inserting our keyword into the ad multiple times now that we have all this extra space?
The answer here is that it depends. First, it’s all about CTR, and generally ads that include the keyword will perform better because they help preserve the “scent of the query”: they make it instantly obvious to the user why the ad is relevant to them. But using the keyword too often may make the ad seem spammy or take away a chance to make other compelling arguments for why a user should visit your site over someone else’s.
As far as DKI goes specifically, Google doesn’t care whether you wrote out the ad in its entirety or used DKI. What they care about is what the ad will look like to a user, so they measure based on what users would see after DKI is handled.
Do keep in mind that DKI is a bonus feature that has to be earned. Low-quality advertisers who don’t bother to group their keywords logically into tightly themed ad groups will see their default text inserted rather than the keyword.
And while I’m on this topic, let me address a common misconception that DKI is risky because you could show some horribly offensive ad when a user does some weird query. That is in fact not true because DKI stands for “dynamic keyword insertion” and NOT “dynamic query insertion.” Google never inserts the query into the ad. It will only insert the keyword that triggered the ad to show.
Quality Score is a machine learning system
Any time AdWords makes big changes, and even when these are not related to QS, they can still impact QS. So I’m a fan of measuring and tracking it so that I can take action if things go sideways. Knowing how to boost CTR and QS also means a lower actual CPC, so the payoff can be worth the time invested.
In the end, it’s important to understand that QS is a machine learning system that uses an incredible number of signals to predict future outcomes. The more certain it is about a correlation, the more weight it will assign to a signal. So for established accounts, QS should not be a mystery, as it truly is the CTR between a keyword and its ad that make up the bulk of the Quality Score.
Unfortunately, because QS is a machine learning system, there are few absolute answers Googlers can share. If QS were a simple piece of code using some if-then clauses, any engineer could share that algorithm and tell us what would happen.
But it’s not that simple. The machine has built its own understanding of the ad auction and makes independent decisions. The best way to understand this complex system is to think logically about what it is trying to do — and that’s to show relevant, high-CTR ads that connect advertisers with customers who need their help.
AdWords script to calculate and track account Quality Score
Some opinions expressed in this article may be those of a guest author and not necessarily Search Engine Land. Staff authors are listed here.
About The Author

Related Articles

